
Summary
This article is the third in series about type-safe implementation of entity models, with support for plug-gable behaviors. The two such behaviors also observed very common in most applications include serialization and deserialization. Implementation considered HOCON for serialized representation. Reason is that HOCON is a user-friendly format to compose entities using minimal boiler-plate. The boiler-plate to describe structural and type composition.
Since the last post, some effort is invested into performance optimizations and design enhancements. Few tools were also explored, specially to benchmark and profile the implementation. This will help understand composition change impacts over the areas of application, for example data API or the pipelines that either consume or produce the entities in the context. This post shares some of the relevant insights. It does not intend to conclude the numbers in one or other way, but sets tone on approach to address optimizations.
What to expect?
Since this post is more about some hands-dirty i.e., hands-on work, let me summarize of what to expect from it, in terms of subject topics:
- Application of JMH to extract benchmarks related to the ADT Serialization and Deserialization trait performance.
- Intent is not to conclude saying we’ve got the best throughput, yet! or that the design considerations are the best among the best. It’s about deriving some validations.
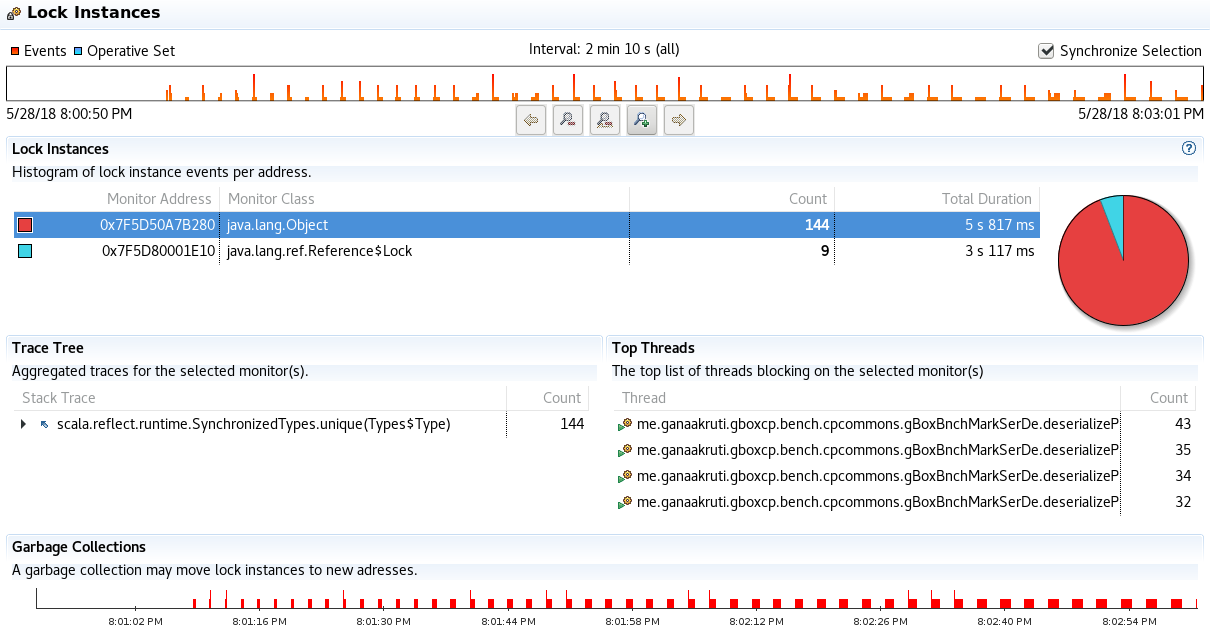
- Have some concerns about locking and performance in use of Scala reflection. Like to come to realization or to prove this external learning as right or wrong.
Don’t think enough justice is being done here with respect to specific tools like JMH, Flamegraphs and JMC/JFR. Content is more around their application towards improving user expectations and experience as they continue to evolve their Problem Domain Entities.
Right Audience!
This article’s content is pretty involved and intense, and probably suits someone with hands on play in Scala, JVM and Performance optimization. However, the Summary, Context, Stats and Visuals may be of some interest to not-so aligned people from tool-stack mix stand point.
Context
The phrase data-driven is now in existence for quite some years. And as we understand from it, data must be tamed and evaluated in an iterative manner. Not by picking few representative samples, but also by the core composition. This leads us to the topic of having to measure our compositions in an iterative manner, derive a gauge and further optimize the composition.
Both the service provides and consumers can benefit from it. For example, while a developer can produce a tangible SLA, users can also continue to leverage the benchmark service to understand impact of their compositions when they start utilizing the services (say, the API). Reduces impact on number of non-relevant service tickets around user experience, freeing up valuable resources to focus on quintessential.
There’s a good overview of data serialization formats on Wikipedia, with a range of available options. We’ve considered HOCON to detail the walk-the-talk. HOCON enables users to define their compositions without having to dwell too much into the supporting boiler-plate. The boiler-plate to hold the structural hierarchy and type information. Further, we sought application of HOCON based entity samples from two most common use cases – Application Configurations and Data-structures that often are observed in service boundaries (like API).
Future work will focus on binary formats to implement these traits, as we begin to look further downstream in the data processing pipeline. Binary formats are better than string based representations when the use case is about machine-to-machine or service-service interaction.
Will start with an insight to the optimization work to improve the design and optimize the implementation approach. Then will share some numbers of sample runs and some visuals to elaborate the detail.
Feel free to reach out to the author via communication channels suggested in footer of the blog-site for any questions or comments..
Optimizations
Just to recap, the implementation design detailed in previous posts considered tree data structures and tree traversal methods to handle serialization and deserialization of entities. It restricted to deal with entities (ADTs) of type T <: gBoxADTBase[T]. It however provides support to handle various types of composite parts (with ADT constraint still applied).
Tree traversals pose some key challenges – skew, depth as well as failures related to type-handling in this particular case. Serialization involves heavy string type usage to represent the extracted values and structure. And, the heavy reliance on Scala type-system features, specially the Reflection API.
Following is the list of some optimizations that were applied, since the previous post:
Eliminate Converters and Redundant Loops
Initial implementation had two uses for Lightbend Config library:
- Parse HOCON string (that represents the serialized state of an entity) using the config library and apply Java-to-Scala converters, such that composite parts are processed to re-construct the object instances.
- Serialization followed a two-phase approach. First convert ADT instance hierarchy into a key-value Map, where the key is a string in dot-notation format. The dot-notation format preserves the hierarchy relation of the attribute and is compatible with the config library to be able to parse maps into output formats like HOCON.
Use of converters produced intermediate collections. This consumes resources – both CPU and memory. These are eliminated with functions that now act on native Java collections. The output will mostly be a Scala buffer if the iteration goes successful, else an error is returned immediately in case of a failure. Also, operations such as List.reverse are eliminated.
Add Cache Support
One of the key processing steps in serialization and deserialization routines is to understand and process data by the respective type inspection. This requires the context to know relevant Type, TypeTag[_], and ClassTag[_] information. For types where language does not support with appropriate representations of these as accessories, the framework will generate them. This often leads to frequent creation of such meta-information. Introduction of cache support eliminates need to derive such meta from scratch, every-time certain type must be treated. The gBoxCPCommons library provides a wrapper around particular cache implementation, where a value function is expected. This function is applied if the cache does not contain a value for the key. This has one side effect, cache layer uses locks to address concurrency aspects for smooth handling of mutation operations. Here’s the code snippet that describes the call to the cache library:
for {
    parsedSrlzdSrc <- gBoxParsingHelper.serializedSourceParser(source = serializedSource, sourceFormat = sourceFormat)
    buildOrder <- checkAndGetMyObjectFromCache[mutable.Queue[(String, TTag, adtType2Process.Value)], ListBuffer[(String, gBoxADTTypeMeta[T, TTag])]](
                 key = s"${tTagRef.tpe.typeSymbol.fullName.trim()}-BO",
                 seedValue = mutable.Queue[(String, TTag, adtType2Process.Value)]((defaultTopLevelNS, tTagRef, adtType2Process.ATOMIC)),
                 valueFn = establishBuildOrder)
    result <- buildMyType[T, TTag](buildOrder, parsedSrlzdSrc)
} yield (result)
Note the line about buildOrder and the valueFn parameter above. The cache function call checkAndGetMyObjectFromCache signature expects the key, seedValue as required by the valueFn and the valueFn itself.
Caching allows frequent type meta information to get cached and optimizes post-warm up phases for better throughput.
Wish list additions
Isn’t there a satisfied customer? Well, at least me not :). During the course of this exercise few nice-to-have features were spotted. For example:
- Top of the list includes application of gBoxADTBase[_] types with opensource frameworks such as Spark, and Flink. No work has been done so far in this direction, but like to run some validations.
- Asynchronous evaluation and processing of composite parts.
- Support for custom builders that can applied to process collections. No functional trigger yet, that is identified and cannot be solved using existing language support.
- Consider support for HLists as argument types, although we have the arity-limit removed on case classes. See SI-7296.
- As you observe in the code snippet above (for-comprehension), the key format yields a longer key value for the cache. Idea here is to retain native unique identifier of an object i.e., it’s Fully Qualified Class Name. On the contrary we don’t want longer keys. Some-point intend to change that.
- Some reading and experience in benchmark runs pointed to performance impacts of Scala Reflection in multi-threaded scenario. Like to explore use of Shapeless Typeable (that avoids use of Scala Reflection API, instead offers a Typeable as a trait and some defaults for known types including primitives). Typeable internally uses isInstanceOf[_] and asInstanceOf[_] constructs.
- As you’ve seen here, there are some concerns about multi-thread performance associated with application of Scala’s Reflection. Some work is slated as next priority to evolve the micro-benchmark framework to assert some of the internal constructs of the implementation, to break-down the numbers observed at the signatures shared here –
.toString()and.hoconToType. See the numbers related to benchmark runs based on single thread and multi-threads (keeping the time duration standard). Some visuals from JMC are also shared for the context.- There’s some influence from the way benchmark runs are timed and resources offered.
- Working with CLI tools is fun, but to enable and empower teams and users in a productive manner, it’d be great to have a service based interface, that allows users to grab the yields from a metrics visualization pipeline. Say for example using Riemann-Prometheus-Grafana is one approach. Will explore some of these (probably with higher priority).
Word of Caution
This is the first pass benchmark testing, and the probing highlighted few key areas of the design that require some more iterations. For example, improvisation over locking side-effects, or application of reflection API and it’s impact in a multi-threaded situation, etc. Benchmarks here are very local to the public interfaces of stand-alone libraries, but represent the behavior in any given distributed implementation, specially on the externalized interfaces. So, consider the numbers and visuals with a grain of salt. Will revisit the numbers during future integration works.
Benchmark Setup
Platform
- Hardware Specs:
- ASUS ROG G750JW Laptop
- CPU: Intel(R) Core(TM) i7-4700HQ CPU @ 2.40GHz, HT enabled and cache capacity L1d & L1I – 32K, L2 – 256K and L3 – 6144K.
- Memory: 32GB RAM
- GPU: NVIDIA® GeForce® GTX 765M
- ASUS ROG G750JW Laptop
- Software Specs
- OS: Linux version 4.9.0-6-amd64 (debian-kernel@lists.debian.org) (gcc version 6.3.0 20170516 (Debian 6.3.0-18+deb9u1) ) #1 SMP Debian 4.9.88-1+deb9u1 (2018-05-07)
- Java Virtual Machine:
- OpenJDK: OpenJDK Runtime Environment (build 1.8.0_171-8u171-b11-1~deb9u1-b11) & OpenJDK 64-Bit Server VM (build 25.171-b11, mixed mode)
- Oracle JDK: Java(TM) SE Runtime Environment (build 1.8.0_171-b11) & Java HotSpot(TM) 64-Bit Server VM (build 25.171-b11, mixed mode)
Build Dependencies
Code to run benchmarks is not part of main-stream code base i.e., core functionality or the unit tests. The key aspect here is to write evolving code that focuses on benchmark scope and public signatures of the library that we would like to benchmark. Hence, a separate SBT project is setup to cover benchmarks. Key dependencies include Scala language, JMH and gBoxCPCommons library.
Following is the build.sbt entries for the context:
"org.scala-lang" % "scala-library" % "2.12.3",
"org.scala-lang" % "scala-reflect" % "2.12.3",
"org.scala-lang" % "scala-compiler" % "2.12.3",
"org.scala-lang.modules" % "scala-parser-combinators_2.12" % "1.0.6",
"org.scala-lang.modules" % "scala-async_2.12" % "0.9.7",
"com.typesafe" % "config" % "1.3.2",
"ch.qos.logback" % "logback-classic" % "1.1.3",
"org.scala-lang.modules" %% "scala-java8-compat" % "0.8.0",
"org.openjdk.jmh" % "jmh-core" % "1.20",
"org.openjdk.jmh" % "jmh-generator-bytecode" % "1.20",
"org.openjdk.jmh" % "jmh-generator-reflection" % "1.20",
"org.openjdk.jmh" % "jmh-generator-asm" % "1.20",
"org.openjdk.jmh" % "jmh-core-benchmarks" % "1.20",
"org.openjdk.jmh" % "jmh-generator-annprocess" % "1.20",
"me.ganaakruti" % "gboxcpcommons_2.12" % "1.0"
Note that Java Flight Record (JFR) is part of Java Management Console (JMC). Use of JMC in non-production scenarios is free, but one need to acquire license to enable it in production. JMH however is a free tool and is also part of OpenJDK Java distribution.
Signatures – Benchmark Scope
For the scope of this article we are going to look at benchmark methods that measure serialization and deserialization. Here are the respective signatures:
- Serialize an instance of
T<: gBoxADTBase[T]ADT type to HOCON string:
@Benchmark
@BenchmarkMode(Array(Mode.SingleShotTime, Mode.AverageTime, Mode.SampleTime, Mode.Throughput))
@OutputTimeUnit(TimeUnit.NANOSECONDS)
final def serializePipeDeploymentSpec(): String = pipeSpec.toString()
- Deserialize HOCON to a corresponding T<: gBoxADTBase[T] ADT type:
@Benchmark
@BenchmarkMode(Array(Mode.SampleTime, Mode.AverageTime, Mode.Throughput))
@OutputTimeUnit(TimeUnit.NANOSECONDS)
final def deserializePipeDeploymentSpec(): Boolean = (pipeSerialized.hoconToType[gBoxCPCEPPipeDeploymentSpec]).isRight
Please note the return type part of the signature. To avoid side effects such as dead-code elimination by the JVM, the signature tends to return the processed values. Otherwise there the benchmarks will not be representative of appropriate outcomes.
Configuration
Besides library documentation within JMH API documentation, there are some nice blog posts that describe the configuration parameters. Some are indicated in the references below. Here’s a quick excerpt of few that are utilized in this work:
- Scope – defined using the @State annotation, indicates the scope of state i.e., objects that are used across benchmark workers. The scope variants include Benchmark (i.e., common across workers), Thread (local to each worker thread) and Group (where one of the group members will initialize the state).
- Warmup – as indicated earlier dependable benchmark procedures must eliminate or handle JVM side-effects such as JIT compilations, etc. Warmup indicated using @Warmup at the benchmark class level will provide necessary setup information. For example, number of warm-up iterations, and maximum time each warm-up iteration must execute.
- Measurement – this is similar to warm-ups, but focuses on measuring the performance i.e., benchmarks. Level of stats generated is indicated at each annotated benchmark level. Refer to the signatures above.
- Forks – this indicates how many times to run the warm-up and measure cycles. It is sequential though. Say we’d like to repeat the experiment for 6 times where for each time a warm-up and measurement iteration set is executed. Note that each fork is run inside a JVM instance.
- JVM arguments such as memory, etc., can be specified here.
Following snippet describes the settings applied (that are common to different ADT samples) in this implementation, at the benchmark class level:
@State(Scope.Benchmark) //There's no state that is shared at this point between threads
@Warmup(iterations = 20 , time = 100, timeUnit = TimeUnit.MILLISECONDS )
@Measurement(iterations = 100 , time = 100, timeUnit = TimeUnit.MILLISECONDS )
@Fork(value = 3, jvmArgsAppend = Array("-Xms768m", "-Xmx768m", "-XX:+UseConcMarkSweepGC", "-XX:CMSInitiatingOccupancyFraction=90", "-XX:+UseCompressedOops", "-XX:+PreserveFramePointer"))
@Threads(2)
Some additional jargon to understand, that can cause decent confusion while interpreting the results:
- Iteration – Iteration is the set of benchmark invocations i.e., operations.
- Operation – more like a unit of work, where a call to a method annotated with @Benchmark is made.
How to run?
Here are the two kinds of command-line flavors to run benchmarks, one with JFR/JMC and other just the benchmarks:
-
- With JMC/JFR (requires Oracle JDK distribution)
sbt -java-home /gdev/tools/jdk8_oracle/jdk1.8.0_171 "jmh:run -gc true -prof jmh.extras.JFR:dir=/gdev/gboxcp/gBoxCPBenchmark/src/test/resources;verbose=true .*deserializePipeDeploymentSpec.*"
-
- Without JMC/JFR (can be run with OpenJDK or Oracle JDK)
sbt "jmh:run -gc true .*deserializePipeDeploymentSpec.*"
Note :
- In either case, recommend to run JMH compilation task prior to the run task. It can be done using the signature
sbt jmh:compile. - The JMC/JFR variant produces a profile.jfr file in the directory path specified using the parameter
jmh.extras.JFR:dir. - Note the flag
-gc true; it enforces full garbage collection before each iteration i.e., batch.
Entity Compositions
Let us now look at the detail from the benchmark runs. To start with, here are the two sample ADT’s.
- gBoxCPCEPPipeDeploymentSpec(contextName, feederCfg, writerCfg,targetDefaultNodes, ...)
@ItsAGBoxADT(doesValidations = true) case class PipeConfig(val key: String, val value: Any) { require(Option(key).isDefined && key.nonEmpty) } @ItsAGBoxADT(doesValidations = true) case class gBoxCPCEPPipeFeederCfg( val contextName: String, val feederCfg: String) { require(Option(contextName).isDefined && contextName.nonEmpty && Option(feederCfg).isDefined && feederCfg.nonEmpty) } @ItsAGBoxADT(doesValidations = true) case class gBoxCPCEPPipeWriterCfg( contextName: String, writerCfg: String, bootStrapParameters: mutable.Map[String, Any] = mutable.Map("MaxRetries" -> 3, "TimeInMillis" -> 10000L, "AuthServiceNodeRole" -> "AuthServices")) { require(Option(contextName).isDefined && contextName.nonEmpty && Option(writerCfg).isDefined && writerCfg.nonEmpty) } @ItsAGBoxADT(doesValidations = true) case class gBoxCPCEPPipeDeploymentSpec( contextName: String, feederCfg: gBoxCPCEPPipeFeederCfg, writerCfg: gBoxCPCEPPipeWriterCfg, targetDefaultNodes: scala.Array[String] = scala.Array( "akka.tcp://gBoxCEPFramework@ghorse1.gbox.net:2551", "akka.tcp://gBoxCEPFramework@ghorse2.gbox.net:2551", "akka.tcp://gBoxCEPFramework@ghorse3.gbox.net:2551"), customConfig: scala.Array[PipeConfig] = scala.Array(PipeConfig("ThrottlePipeSingleton", true).get, PipeConfig("PauseBetweenRetries", 1000).get), bootStrapSettings: mutable.Map[String, Any] = mutable.Map("MaxRetries" -> 3, "TimeInMillis" -> 10000L, "SeedNodeRole" -> "seed")) - Person(id, name, height, address, contactInfo, detail)
@ItsAGBoxADT(doesValidations = true)
case class Address(val streetNumber: Int, val streetName: String, val cityName: String, val zipCode: String, val country: String) {
    require(streetNumber > 0 &&
            Option(streetName).isDefined && streetName.nonEmpty &&
            Option(cityName).isDefined && cityName.nonEmpty &&
            Option(zipCode).isDefined && zipCode.nonEmpty &&
            Option(country).isDefined && country.nonEmpty)
}

@ItsAGBoxADT(doesValidations = true)
case class AdditionalPersonalInfo(val key: String, val value: Any) {
    require(Option(key).isDefined && key.nonEmpty)
}

@ItsAGBoxADT(doesValidations = true)
case class ContactInfo(val phoneNumber: String, val emailAddress: String,
val webSite: String, val additionalInfo: Array[AdditionalPersonalInfo] = Array(AdditionalPersonalInfo("SomeKey", "someValue").get, AdditionalPersonalInfo("SomeKey1", "someValue1").get)) {
    require(Option(phoneNumber).isDefined && phoneNumber.nonEmpty && phoneNumber.length == 10 &&
            Option(emailAddress).isDefined && emailAddress.nonEmpty &&
            Option(webSite).isDefined && webSite.nonEmpty)
}

@ItsAGBoxADT(doesValidations = true)
case class Person(val id: String, val name: String, val height: Double,
val address: Address, val contactInfo: ContactInfo, val detail: Map[String, Any] = Map("FirstAddress" -> "FirstStreet,FirstCity")) {
    require(Option(id).isDefined && id.nonEmpty && id.length == 6 &&
            Option(name).isDefined && name.nonEmpty && height > 2.0 && height < 8.0 &&
            Option(address).isDefined && Option(contactInfo).isDefined)
}
Note, the varying complexities above indicate the traversals to perform, depth and skewness. For example, the simplest hierarchy is that of Address entity, and the relatively complex entity being the gBoxCPCEPPipeDeploymentSpec. Also, note the use of various types.
Parsed output from Typesafe Config library produces Config objects. Collections are represented as Lists. There is no default support for maps. To work on those collections, earlier implementations made use of Java to Scala converters. This resulted in additional temporary collections, though they are localized references and are discarded soon downstream computation is over. This is mentioned in the optimization section above.
Profiling Insights
CPU Time Utilization – Flame-graphs Sample
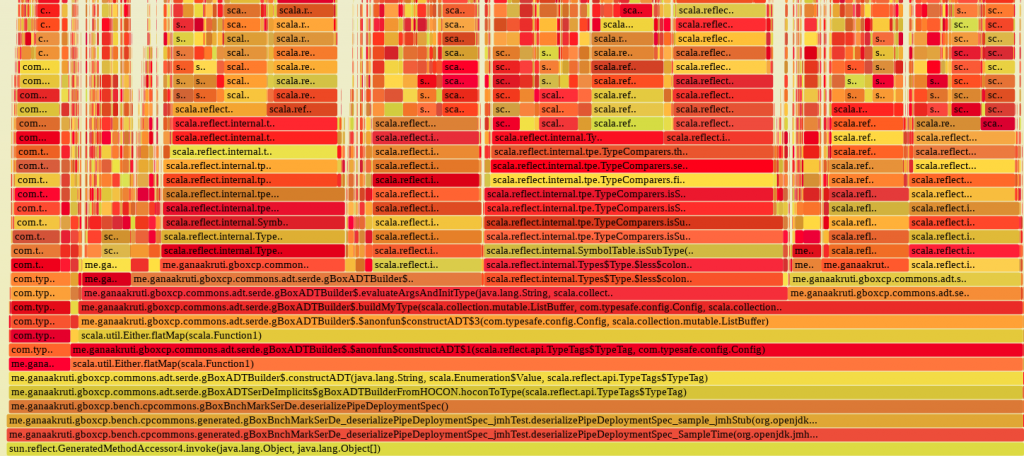
Below is the sample flame graph based on Java Flight Records from benchmark run with single thread. The top of the flame is the process that consumed the most CPU, with lower levels indicating the ancestry. That is, the processes or steps that lead to this current process.
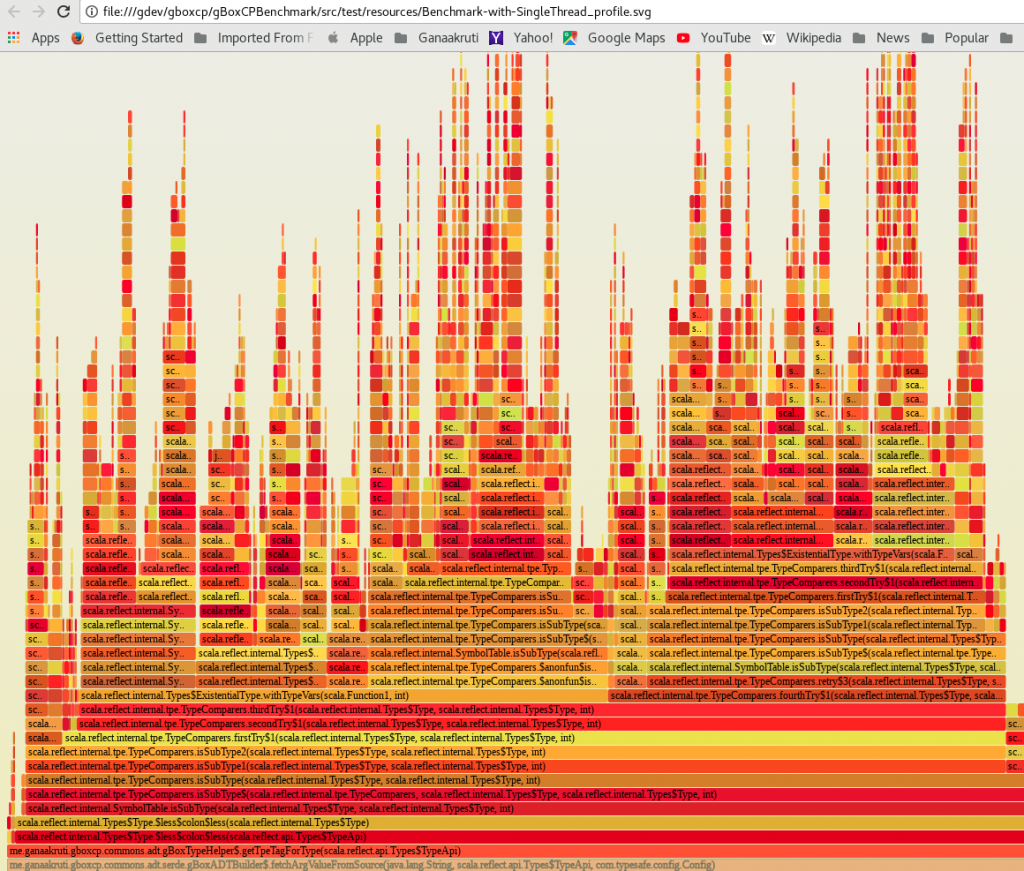
The next one below explains the call trace that lead to the work for the reflection API, where most CPU time is spent:
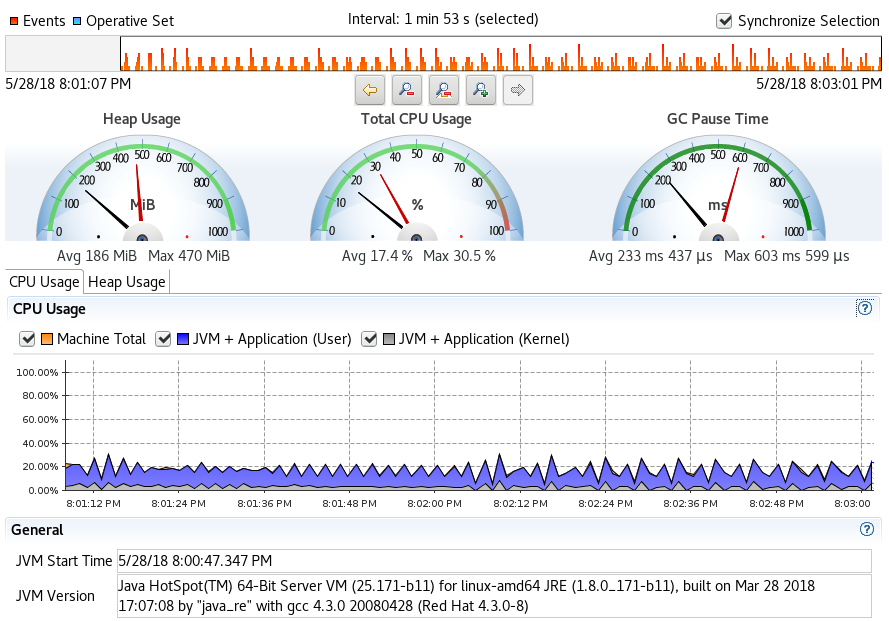
Comprehensive Usage across thread allocations 1, 2, & 4!
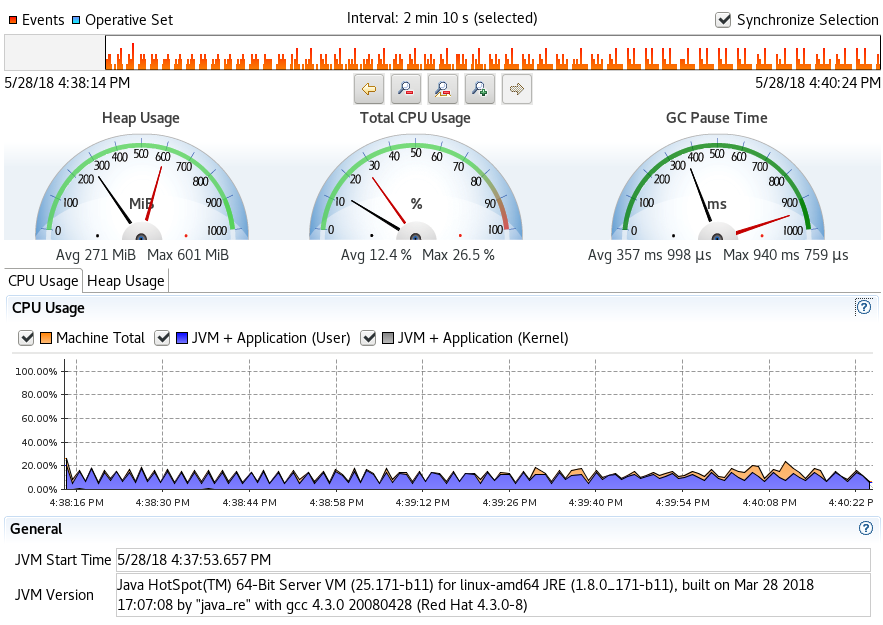
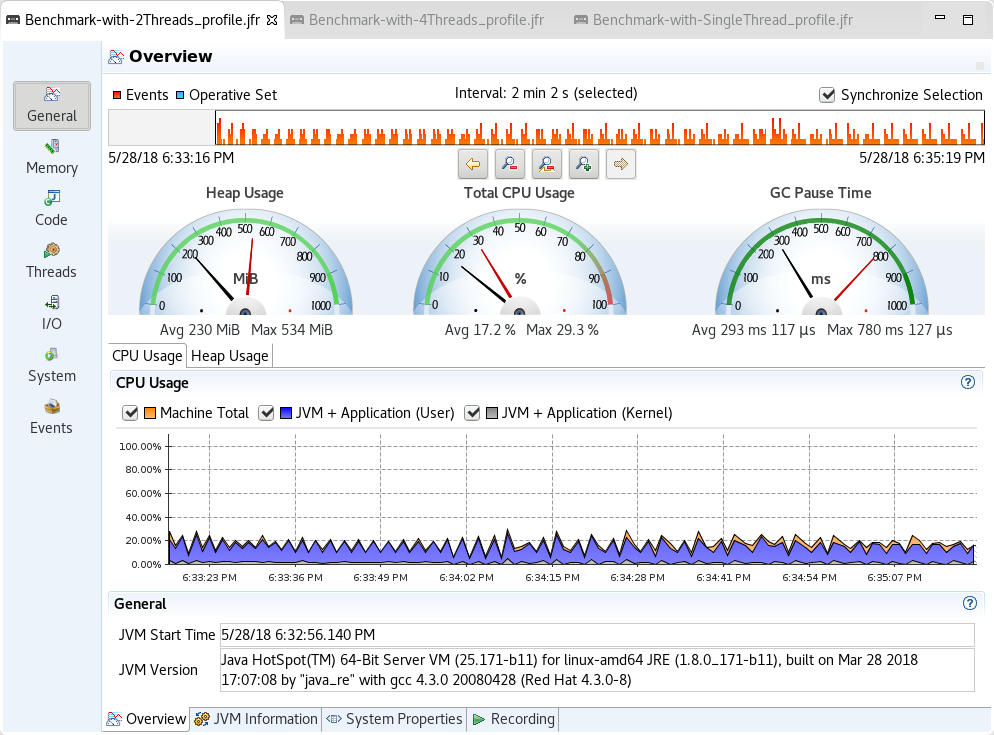
This section shares quick snapshots of CPU and Heap usage as observed from the Java Flight Records. The snapshots represent each run with different thread allocation for the benchmark sequence – 1, 2 and 4 threads for each discrete run.
- Single thread profile
- 2 Threads Profile
- 4 Threads Profile
Lock Instances – Contention Sample
Statistics
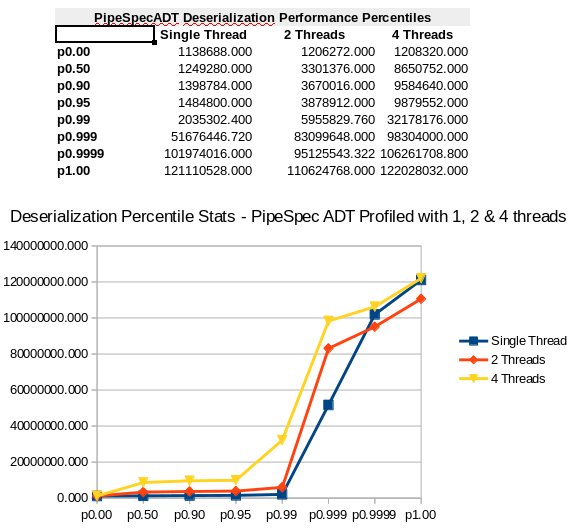
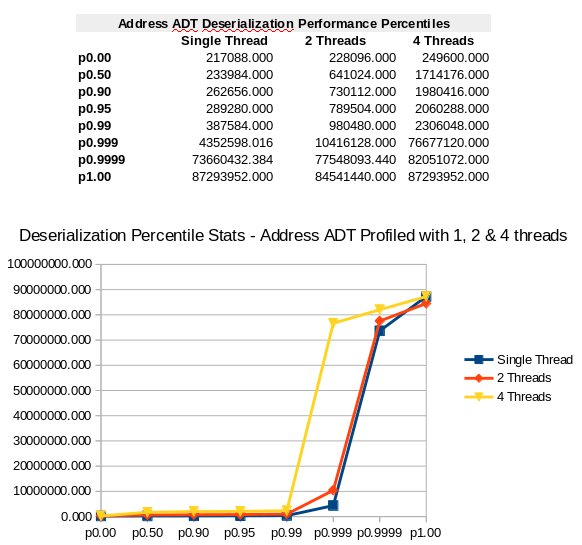
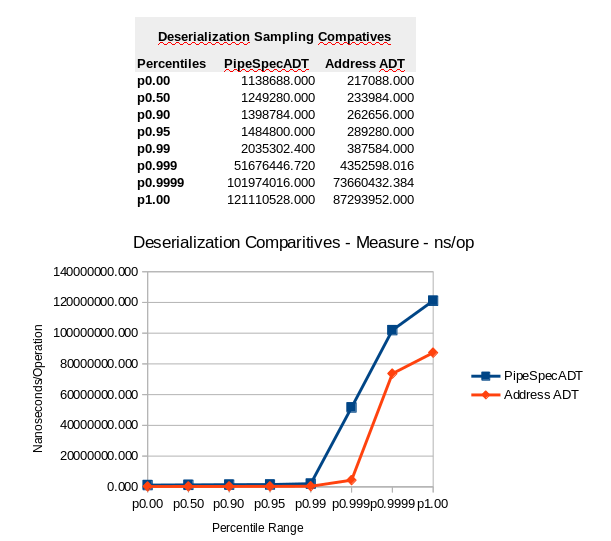
End-to-End Performance Samples
Pipe Specification ADT
Address ADT
Comparative Performance – Simple to Complex ADT Compositions
Cache Performance (Address ADT Sample)
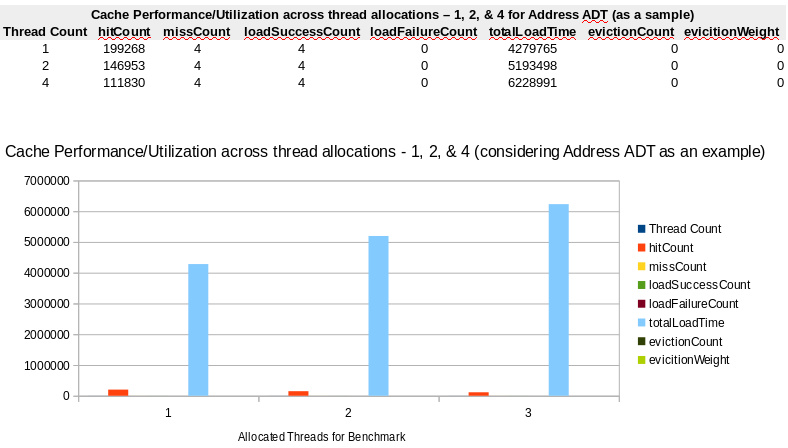
As you observe from these measures, while the hitCount is subjective to benchmark configuration (threading primarily), the missCount and loadSuccessCount values remain static i.e., same. A cache miss occurs when the cache does not have an entry for the key. The implementation lazily evaluates the value for a key and adds to the cache, if there is no value for a given key. The parameters missCount and loadSuccessCount are incremented for a successful addition of a cache value. More details can be accessed from Caffeine Cache library API documentation.
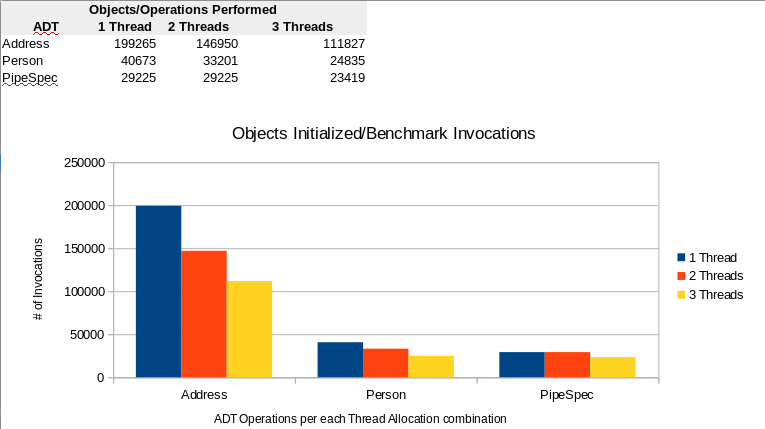
Throughput Numbers
Throughput numbers indicated in the cache stats, cover the scope of measures. Instead the benchmark code is augmented with @AuxCounters. AuxCounters are part of the JMH framework. These are set at the thread level and introduced at each iteration cycle. Below visual provides some context into total number of Operations i.e., invocations of @Benchmark methods are made during each iteration:
Thoughts to further!
Could have said thoughts for future, but utilizing time as it permits, have some thoughts to further the process here. Some future targets are indicated in the section on wish list items above. The current approach will be applied towards application configuration management use cases associated with gBox Conversational Pipes framework.
References
- Scala Language
- JDK
- Frameworks
- Blog Posts
- Java Caching Benchmarks
- The 6 Memory Metrics you should track in your Java Benchmarks
- Ways to pattern match generic types in Scala
- Flamegraphs
- Automatic Flamegraph generation from JMH-Benchmarks using SBT:JMH
- Profiling JVM Applications
- Java memory allocation Flamegraphs
- Java in flames
- Avoiding Benchmarking Pitfalls on the JVM
- Benchmarking Scala Collections
- Java Performance and Profiling
- Java Performance and using Java Flight Recorder
- Tracing and profiling Java (and Native) applications in Production
- Scala and 22
- Fix the arity limitations/implementation restrictions of tuples, functions, case classes
- Using JMH to Benchmark Multi-Threaded Code
- Testing Code Performance with JMH Tool
- Git
- Stackoverflow